
A dental office productivity dashboard brings production, collections, patient activity, and payment timing into one view, helping you see how the practice is performing and where attention may be needed. One useful measure is the collection rate: revenue collected divided by net production for the same period. Viewed together, these figures connect the work completed with the revenue received.
It’s easy to focus on production alone, but a full schedule doesn’t necessarily mean payments are keeping pace or patients are returning for care. Comparing related measures side by side gives you a clearer basis for decisions.
This guide explains what a dental practice KPI dashboard shows and how to interpret production, collections, patient metrics, accounts receivable aging, and days to payment. It also covers how to choose useful measures and turn dashboard signals into practical next steps for your team.
Key Takeaways
- Compare production with collections and patient activity to spot patterns that a busy schedule alone can hide.
- Use net production and collection trends to identify where payment performance may need attention.
- Track treatment acceptance alongside unscheduled care to see where follow-up could help patients move forward.
- Review accounts receivable by age so your team can prioritize older balances and improve payment follow-through.
1. Practice production, collections, and patient metrics
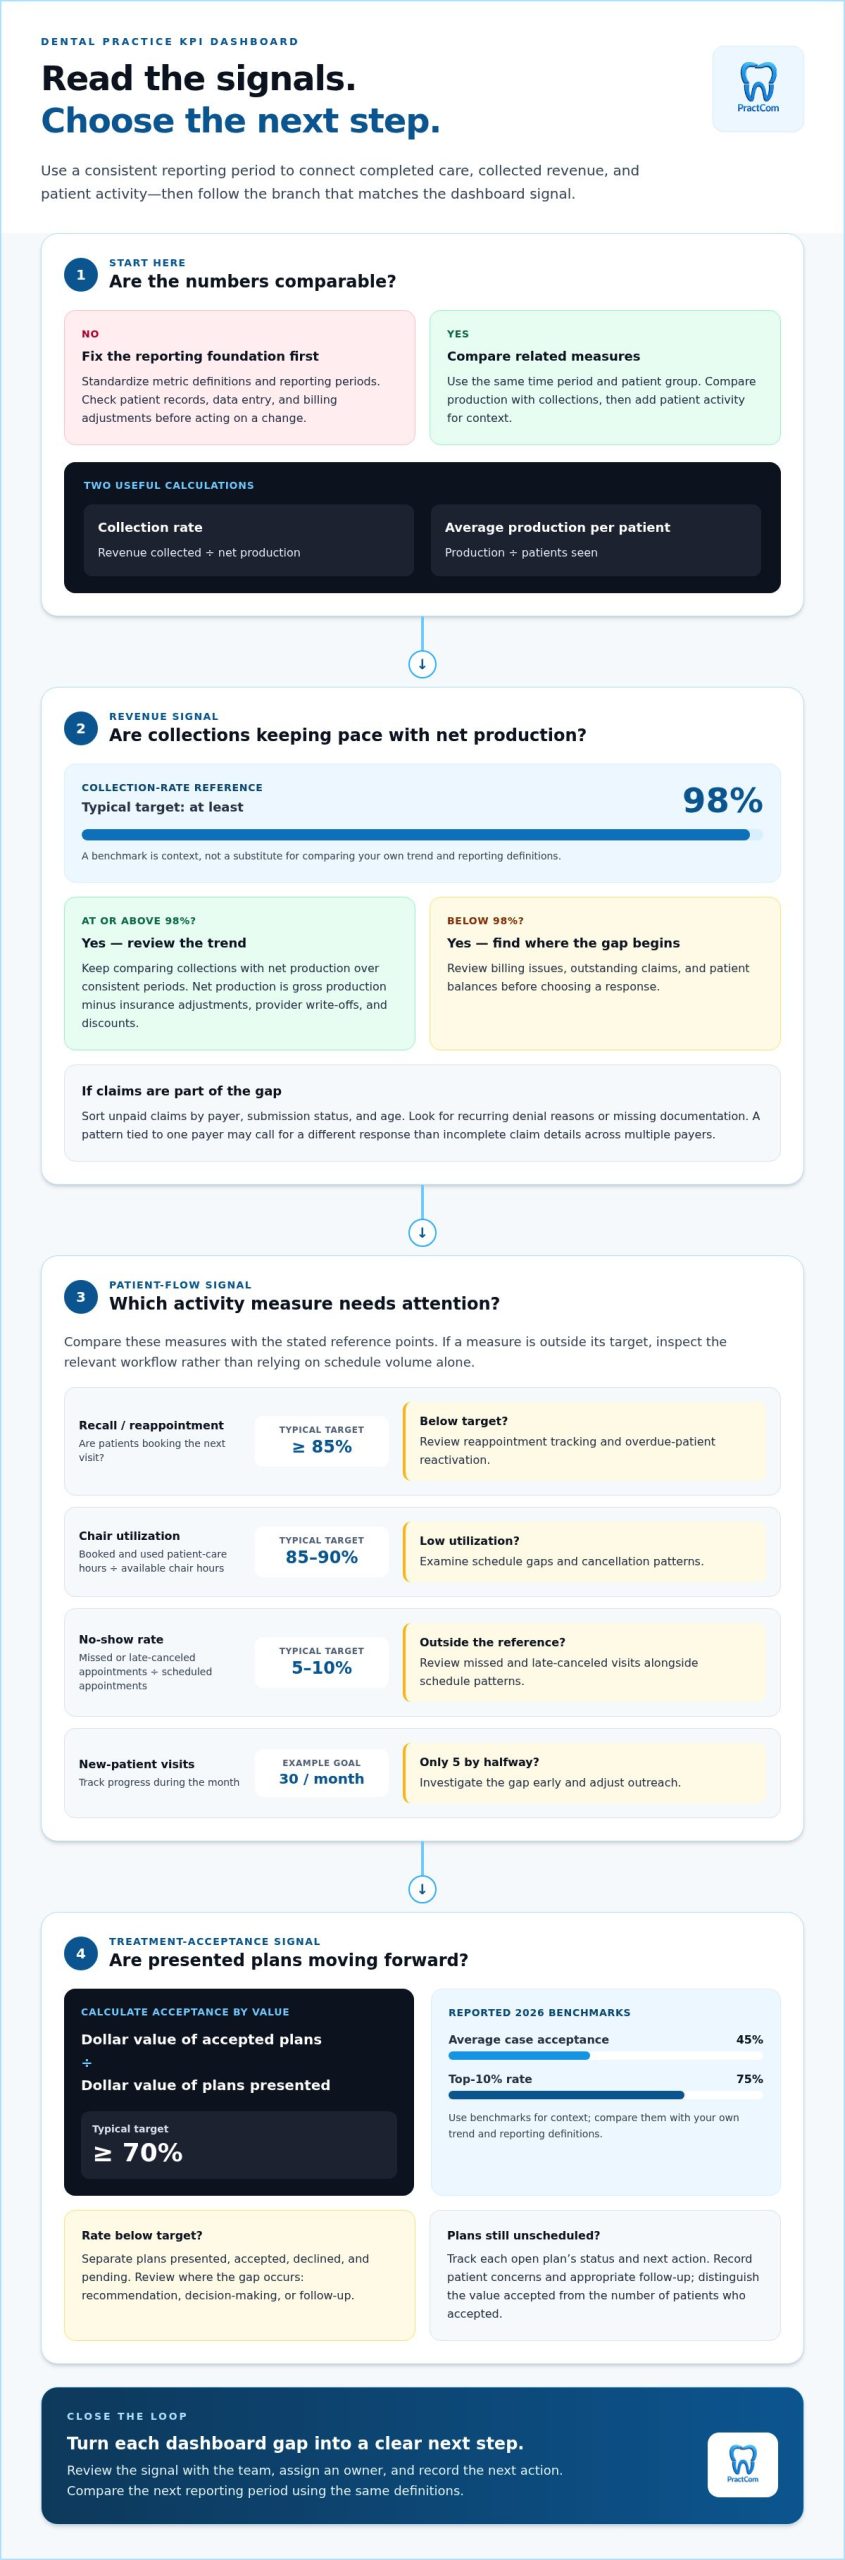
Start by comparing production and collections for the same period, then add patient activity for context. Calculate the collection rate by dividing revenue collected by net production. To track average production per patient, divide production by the number of patients seen, using the same time period and patient group each time. This gives owners a clearer view of revenue alongside patient volume, rather than relying on a busy schedule alone.
Some dental practice management systems include productivity dashboards, while practices may use a connected analytics tool. Common measures draw on scheduling, clinical, and billing records, so consistent data definitions are essential.
What KPIs should a dental office productivity dashboard track? Begin with new-patient visits, recall or reappointment rate, no-show rate, chair utilization, production, and collections. A typical recall or reappointment target is at least 85%, while a typical chair-utilization target is 85–90%. Chair utilization compares chair hours booked and used for patient care with total available chair hours. No-show rate compares missed or late-canceled appointments with scheduled appointments; its typical target is 5–10%.
For new-patient tracking, a practice could set a goal of 30 new patients per month and review progress weekly. If five new patients have arrived by the month’s halfway point, the team can investigate the gap early and adjust outreach. Reactivation metrics help identify patients overdue for care, while reappointment tracking shows whether patients schedule their next hygiene visit before leaving.
To assess provider, hygienist, and front-desk productivity, compare provider and hygiene schedules with completed care, and track front-desk activity such as outgoing calls and reappointments. These measures can help managers pinpoint workflow bottlenecks and assign practical next steps.
Incomplete patient records, inconsistent reporting periods, and mismatched billing adjustments can make productivity metrics misleading. Standardize definitions, check data entry, and compare the same periods before acting on a change.
2. How Can Dentists Use Data Analytics to Benefit Their Practice?
Use analytics to connect production, insurance adjustments, and payments. Net production is gross production minus insurance adjustments, provider write-offs, and discounts. Comparing collections with net production helps owners assess whether completed care is translating into collected revenue. Keep the reporting period consistent so differences in timing don’t distort the comparison.
A typical collection-rate target is at least 98%. Collection-rate benchmarks can provide context, but practices should compare them with their own trends and reporting definitions. These are distinct reference points, not interchangeable targets. Review the practice’s own trend alongside its benchmark, then examine billing issues, outstanding claims, and patient balances before choosing an action.
Insurance analysis can help show where payment delays begin. Sort unpaid claims by payer, submission status, and age, then look for recurring denial reasons or missing documentation. A pattern linked to one payer calls for a different response than incomplete claim details across multiple payers. Track follow-up actions to see whether the underlying issue changes.
Hygiene reporting connects scheduling with production and continuity of care. Review hygiene utilization, conversions, and treatment options against budget to assess whether available appointment time supports planned revenue. If utilization is low, examine schedule gaps and cancellation patterns. If conversions or treatment options lag, review how recommendations are presented and whether patients have a clear next step.
Separate hygiene visits completed from appointments scheduled, and compare both with collections over the same period. This helps distinguish a scheduling shortfall from a payment-follow-up issue. Review the dashboard with the team, assign an owner to each gap, and record the next action. For practices organizing their reporting workflow, explore practice dashboard resources.
3. What is a Dental Practice KPI Dashboard?
A KPI dashboard makes practice data easier to review, helping owners monitor efficiency and decide what to do next. For treatment acceptance, it can show plans presented, accepted, and still unscheduled. Reviewing these stages separately helps identify whether the gap occurs during recommendation, decision-making, or follow-up.
Treatment acceptance rate is calculated by dividing the dollar value of accepted treatment plans by the dollar value presented. A typical target is at least 70%. The reported 2026 average case acceptance rate is 45%, while the reported 2026 top-10% rate is 75%. These benchmarks provide context; compare them with your own trend and reporting definitions.
Acceptance tracking should distinguish the number of patients from the value of treatment. A patient may accept one part of a plan while deferring another, so counting accepted cases alone can hide the value of outstanding care. Use consistent categories for presented, accepted, declined, and pending treatment, then compare them across the same reporting period.
For unscheduled treatment, create a follow-up view showing each open plan’s status and next action. For example, a plan marked pending can prompt the team to document the patient’s concern and arrange appropriate follow-up. Reviewing the report at a team meeting can reveal communication or scheduling barriers without treating every delay as the same problem.
How much do dental productivity dashboard tools and software cost? The price depends on the case and is given after a quote request; cost factors include practice size, integrations, reporting features, and contract terms. Compare the functions you need, such as treatment tracking and visual reporting, rather than paying for metrics your team won’t use.
Assign an owner and a next step to each measure. If acceptance changes, review plan presentation and follow-up records before changing workflows. This keeps dashboard data connected to patient decisions and practical action.
4. Accounts receivable aging and days to payment
An accounts receivable aging report groups unpaid balances by how long they’ve remained outstanding. Dental practices commonly review 0–30, 31–60, 61–90, and 90+ day ranges. This view shows whether balances are recent or require more focused follow-up. Older unpaid balances are harder to collect than newer ones, so the age of a balance helps teams prioritize operations.
A typical accounts receivable target is less than 30 days. Track days to payment by measuring elapsed time between providing care or submitting a claim and receiving payment. Use consistent start and end points across reports; otherwise, software comparisons may reflect different definitions rather than changes in collections performance.
Review each aging band with a specific action. For balances in the 0–30 day range, confirm that claims and statements have moved through the usual workflow. For older balances, identify whether the next step involves claim follow-up, correcting information, or contacting the patient. A clear status makes practice management more systematic and reduces the chance that an account sits without attention.
Staff accountability makes reports more useful. Assign one person to each measure and define the next step, such as reviewing outstanding claims or documenting follow-up. A manager can review the aging report with the billing team, record unresolved items, and check progress at the next meeting. This connects collections work to daily operations without relying on memory.
Use the dashboard to look for patterns, not just totals. If the 31–60 day band grows, compare claim status, payer response, and billing workflow. If balances move into 90+ days, prioritize an account-level review because older unpaid balances are harder to collect. Tracking these changes helps owners judge whether collection processes support financial success and where the team needs a defined action.
PractCom: Post-Treatment Instruction Library
PractCom’s Post-Treatment Instruction Library supports the patient communication workflows that sit alongside performance tracking. It includes over 80 post-treatment templates, helping your team provide consistent care instructions after treatment. Documents can be delivered by email, text, or print in 15 languages, giving patients a clear reference for their next steps.
Use PractCom’s Post-Treatment Instruction Library when your team wants to standardize how it shares guidance after visits. PractCom also offers Digital Informed Consent Forms and a Patient Portal, supporting a more organized communication process. These tools support patient communication, but they are not a full practice management system.
If you’re considering a more consistent approach to patient documents, contact PractCom to learn more.
Turn Dashboard Signals Into Your Next Practice Improvement
A dashboard is more useful when it shapes the team’s next decision. Choose one operational question that matters now, such as whether a workflow is causing avoidable delays. Agree on an action, then revisit the same measure to see whether the pattern has shifted. This keeps reporting focused on practical improvement rather than adding another task to maintain.
Your dental office productivity dashboard can complement tools for patient communication. PractCom offers a Post-Treatment Instruction Library, Digital Informed Consent Forms, and a Referral Management System. These tools help organize patient-facing workflows while your team uses performance data to guide practice decisions.
If you’re ready to discuss how a dashboard could support your practice, contact PractCom about your dashboard. Take the next step at a pace that works for your team, and build a clearer path from insight to action.
Frequently Asked Questions
What is a Dental Practice KPI Dashboard?
A dental practice KPI dashboard is a visual reporting tool that organizes key performance indicators for review. For example, an owner might compare staffing costs with schedule utilization to decide whether a workflow needs attention. Green, yellow, and red indicators can make status easier to scan when each color has a defined range. The dashboard is most useful when its measures support decisions the team can act on.
How Can Dentists Use Data Analytics to Benefit Their Practice?
Dentists can use analytics to identify patterns and prioritize operational changes. For example, comparing hygiene utilization with conversions and treatment options against budget may show whether the issue lies in scheduling capacity or treatment follow-through. Reviewing trends over consistent periods helps distinguish recurring problems from isolated fluctuations. Assign a next action to the pattern, then assess whether the measure changes after the team implements it.
What Are KPIs in Dental?
Dental KPIs are measurable indicators of clinical, financial, and operational performance. Examples include patient retention, treatment acceptance, chair utilization, collections, and appointment attendance. Choose measures that reflect your practice’s current priorities, such as productive hygiene schedules or continuity of care. Start with a focused set, define how each measure is calculated, and add more only when they can guide a clear decision.
How do you turn dashboard insights into team action?
Turn an insight into action by naming the issue, assigning one responsible person, and defining the next step. For example, if reappointments fall below the practice’s goal, the team lead could review checkout procedures and assign follow-up responsibility. Use a SMART action plan with a clear outcome and review point. Record progress so the next discussion focuses on what changed, not just the color of a chart.
How often should office managers review these metrics?
Office managers can review dashboard metrics monthly and remove measures that no longer support decisions. Daily or real-time updates can help teams respond promptly when a metric begins to slip. Use brief operational check-ins for urgent scheduling or workflow issues, then reserve the monthly review for trends, priorities, and whether the indicators remain useful. A consistent schedule keeps dashboard reviews focused without making them purely reactive or disconnected from practice goals.
What Can Improve Productivity in a Dental Office?
Teams can improve productivity by reducing avoidable administrative friction and organizing work around patient appointments. Letting patients complete and review essential forms online before visits can make information available earlier in the workflow. Practices can also group predictable tasks, such as preparing treatment plans for scheduled hygiene blocks. Review schedule gaps and assign clear responsibilities so clinical and front-office staff know what needs attention next.

Article by
Cary Ganz DDS
Dr. Cary H. Ganz is a dentist, prosthodontist, entrepreneur, lecturer, and author with more than 50 years of experience in clinical dentistry and dental technology. Throughout his career, he has combined hands-on patient care with a deep understanding of how technology can improve dental practice operations, communication, documentation, and patient outcomes.
In addition to his clinical background, Dr. Ganz has held significant leadership roles in the dental technology industry, including Past Owner and Vice President of Clinical Affairs at DEXIS Digital Radiography and Past Vice President of Clinical Affairs at Denticon Practice Management Software. His business experience includes product development, clinical strategy, dental software innovation, practice management solutions, and educating dental professionals on the effective use of technology in modern dentistry.
Today, Dr. Ganz continues to focus on creating practical technology solutions for dental practices, including PractCom, a comprehensive dental practice communication platform designed to improve patient communication, documentation, compliance support, referrals, and overall practice efficiency. His work reflects a career-long commitment to helping dentists deliver better care while making their practices more organized, efficient, and protected.
No responses yet